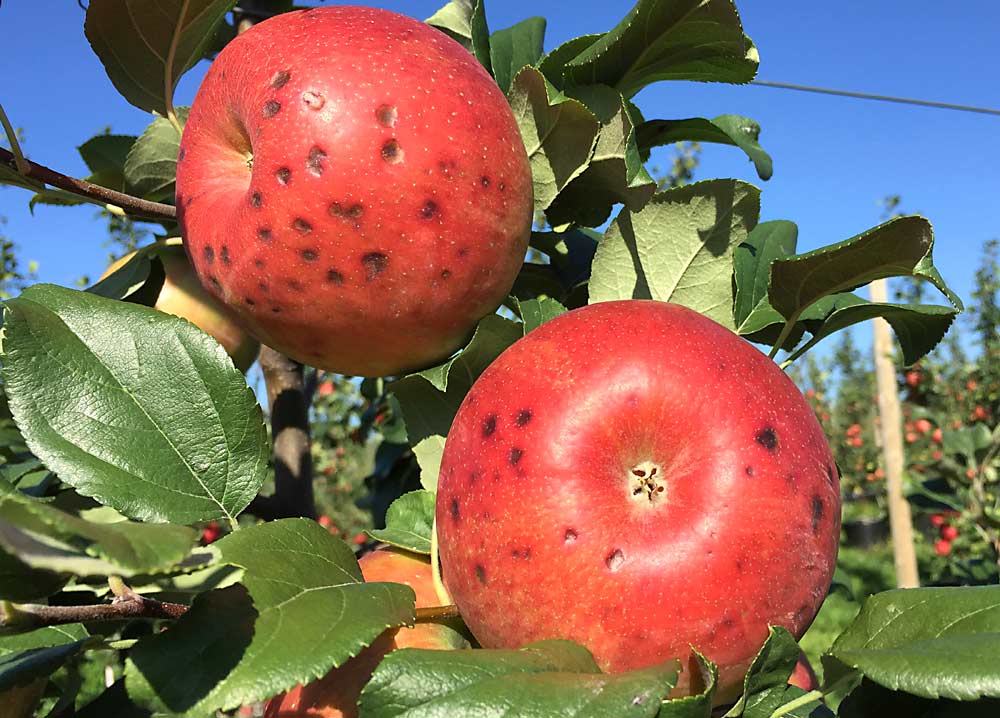
The growing demand for Honeycrisp poses a dilemma for storage operators.
The profitable variety is susceptible to bitter pit, a postharvest disorder that can make it unsellable. But the more popular Honeycrisp becomes, the greater its need for long-term storage — and the higher the risk of bitter pit losses.
Predicting which bins will come out of storage with bitter pit, and at what percentage, has always been a guessing game. But longer storage means guessing wrong gets more expensive.
“When you’re trying to store Honeycrisp into May and June, you need to be more precise,” said Scott Henning, chief operating officer of Lake Ontario Fruit, a Western New York packing house. “Being off by even 10 or 20 percent can be huge in grower returns.”
For the past few years, Henning has been helping Cornell University scientists develop a multilayered method that can improve the accuracy of bitter pit prognostications: the Bitter Pit Passport.
Cornell tree fruit physiologist Terence Robinson, a member of the team that first announced the passport concept two years ago, said they aim to help storage operators categorize Honeycrisp fruit based on bitter pit risk and to give growers mitigation strategies for blocks that have a history of bitter pit.
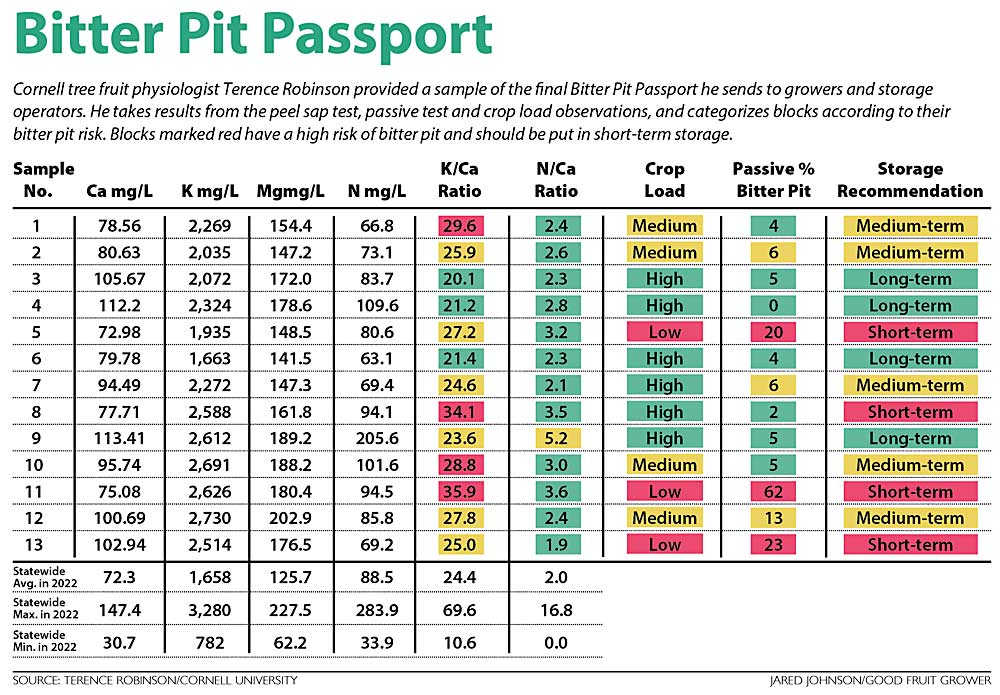
Robinson said the passport uses three main factors to assess the bitter pit potential of Honeycrisp orchard blocks and uses those assessments to make storage recommendations.
The first factor is a visual estimation of the crop load after thinning. Low crop loads tend to have more bitter pit; high crop loads have less. Therefore, a high crop load will earn a long-term storage recommendation and a low crop load a short-term recommendation.
The second factor is a measurement of nutrient levels in the peel of the fruit. In July, researchers and fieldmen collect 50 fruitlets from each block, take peel samples from each and use the peel sap test to measure the ratio of calcium to other nutrients. While bitter pit is a complex disorder, years of research shows that the ratio of calcium to competing potassium is strongly predictive. Adding other nutrients to the ratio adds to its effectiveness.
The third factor: an estimation of bitter pit incidence using the passive evaluation method. About three weeks before harvest, they collect 100 apples from at least 10 trees in a block and store them at 68 degrees Fahrenheit. A day or two before harvest, they take the fruit out of storage and check for signs of bitter pit. The percentage of bitter pit in the sample should indicate the percentage of bitter pit that will emerge in the block it came from.
Just before harvest begins, Robinson gathers the results from all three factors — crop load, peel sap test and passive test — lines them up on a spreadsheet and makes a “human judgment” about that block’s bitter pit potential. He then emails his final storage recommendations to the packer or grower.
It’s a process industry players can do on their own, and Robinson hopes they will continue after Cornell winds down its efforts in the next couple of years.
Henning said he’ll continue using the Bitter Pit Passport. When ranking blocks according to their bitter pit potential, he follows Robinson’s three main steps. He also considers the blocks’ bitter pit history.
Before using the passport, Lake Ontario Fruit relied on bitter pit history and current crop load observations to make predictions. They knew that factors like aggressive leader growth, top working and vigorous rootstocks could aggravate bitter pit in a block. Those observations are now incorporated into the passport concept, Henning said.
“You have to have multiple sources of data to make the best decision,” he said. “(The Bitter Pit Passport) is not 100 percent, but nothing is.”
Test details
Cornell apple physiologist Lailiang Cheng, another member of the Bitter Pit Passport team, discussed the peel sap test in more detail.
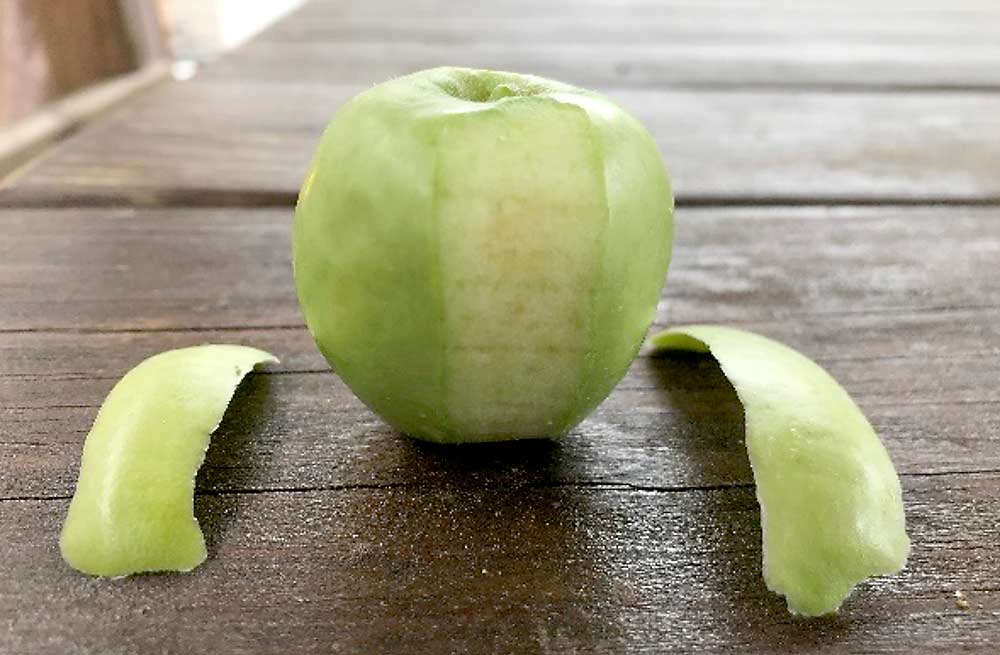
Cheng’s research group takes peel samples from golf-ball-sized (55–60 gram) fruit in early July and measures nutrient levels in the juice squeezed from each sample. They use a technique known as inductively coupled plasma spectrometry to directly measure the nutrient content of the juice more quickly than traditional techniques that require samples to be dried and digested before analysis.
The original peel sap test measured potassium, calcium, magnesium, phosphorus, sulfur and boron, but Cheng recently found a way to measure nitrogen from the same samples — which Henning called a “huge” breakthrough for predicting bitter pit and fruit size.
Cheng said trees with high nitrogen levels grow with more vigor, which pulls more calcium into shoots and leaves and away from the fruit where it’s needed to stabilize cell membranes and cell walls. Too much nitrogen in the fruit itself promotes cell expansion, making it more susceptible to bitter pit and other disorders. Fruit with high nitrogen levels also fail to color well.
He also said the peel sap and passive tests are best used in combination. Data have shown that the passive test tends to better predict bitter pit risk than the peel sap test, most likely because the samples are taken closer to harvest. But results of the passive test, coming just before harvest, don’t give growers time to perform bitter pit mitigation measures.
Peel sap results, on the other hand, give growers a couple of months to implement mitigation measures, including more frequent calcium sprays, less irrigation and holding back on ReTain (aminoethoxyvinylglycine) or Harvista (1-methylcyclopropene) applications, Cheng said.
—by Matt Milkovich





Leave A Comment