Sales of organic fruits and vegetables were up 15 percent and accounted for one-third of all organic food sales. And Washington organic tree fruits were no exception.
Sales continue to grow, prices have been good, and growers are contemplating certifying many more acres in the next few years.
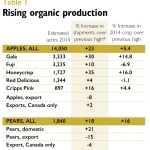
While total shipments of Washington organic apples were down for the 2013 crop compared to the previous year, this was due to the smaller crop that sold out earlier. The 2014 organic crop, at an estimated 10 million boxes, surpassed previous records, and shipments are ahead of the previous high years for both apples and pears (see Table 1).
Over 7.5 million boxes of organic apples have been sold, with Honeycrisp and Jonagold organic apples sold out. Nearly all organic pears have been sold, and the 2014 crop was 16 percent bigger than the previous high.
Prices (season-to-date average to mid-March) for all apples and pears are lower for the 2014 crop than the previous year.
Average prices for most conventional apples are down $2 to $6 a box, with Honeycrisp off $8 a box, and Cripps Pink unchanged. Conventional pears are up $2 a box. Prices for organic apples are off by $2 a box for many varieties, by $5 a box for Fuji and Cameo, and by $10 a box for Honeycrisp. Cripps Pink is up $2 a box, and Granny Smith is unchanged. Both organic d’Anjou and Bosc are up $1 a box.
The drop in Honeycrisp price from stratospheric levels is not unexpected as production volume has ramped up.
But the price premium for organic apples is strong: 90-100 percent for Red Delicious, Golden Delicious, Granny Smith, Fuji, and Gala; 70 percent for Braeburn and Cameo; 47 percent for Cripps Pink; and 22 percent for Honeycrisp. In comparison, Gala and Fuji, the two largest volume organic apples, had premiums of 70 percent for the 2013 crop.
Thus, organic apples are holding up better than conventional in the difficult market. This can be attributed to the strong shipments to the domestic market (see Table 1).
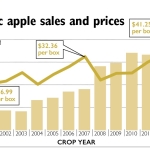
Overall exports are down, but the majority of exports go to Canada, where there was no effect from the port slowdown. And, over the past few years, organic apple prices have increased along with increasing supply (see Figure 1), suggesting that demand is still not being met.
While other regions of the United States are increasing their production of fresh market apples, Washington remains the dominant supplier of organic product.
So where is all this going?
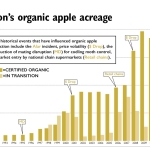
The relatively high organic prices are being noticed. We have seen similar situations in 2001 and 2008, with large acreages of organic apples in particular entering the market at the same time (see Figure 2).
In both cases, prices dropped due to the new supply overshooting demand. Then acreage leveled off, while demand kept growing and eventually caught up or surpassed supply. With the typical three-year transition period to bring orchards into organic certification, there is a built-in lag in the ability of growers to respond immediately to market signals.
Each year, we present the current status of organic tree fruits at winter meetings to help people understand the trends and make more rational decisions.
In the past, prior to the National Organic Program in 2002, most acres destined for organic certification went through a formal transition status with the certifier in advance, allowing us to see big acreage increases coming in advance. That is no longer the case, and instead, we have occasionally polled the industry about expansion intentions.
This past winter, clicker surveys were done at five different grower meetings to gauge people’s intentions as far as expansion.
In part, we wanted to know whether concerns about the loss of antibiotics for fire blight control were allayed with the recent research advances. Apparently they have been.
In January 2012, 93 percent of grower responses indicated they would reduce organic apple and/or pear acreage, or exit organic altogether, once antibiotics were no longer allowed.
This dropped to 39 percent in January 2015. When asked about plans to expand organic tree fruit production over the next five years, 66, 41, and 59 percent of growers (Washington, California, upper Midwest, respectively) said they planned to add more acres, while 25, 54, and 41 percent planned to stay about the same.
Very few expected to decrease acres or exit altogether.
Washington growers were then asked to estimate the number of acres per fruit type, using pre-set ranges (1-20, 21-40, 41-60, 61-80, 81-100, 101-150, 151-200, and over 200 acres), since the clickers could not accept a typed-in number response.
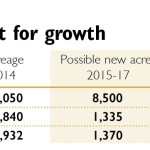
For each range, the number of responses was multiplied by the mid-point, and then all ranges added together to develop rough estimates. Based on this, growers may increase organic acreage in the next two to three years as follows: apples, 8,500 acres; pears, 1,335 acres; cherries, 1,370 acres.
Compare these to the existing certified acres in Table 2 and these are very large increases. This is a departure from the generally stable acreages seen since 2009.
The transition acres reported in 2014 are much smaller than the survey results (783 for apple, 84 for pear, and 57 for cherry), confirming that reported transition acres are no longer a reliable gauge of future growth.
Organic tree fruit is expanding elsewhere as well. Organic apple acres have grown 40 percent a year for the past few years in Europe, driven by Poland and Germany.
Worldwide, organic cherry acreage expanded 15 percent per year, and organic pear acreage was up 2 percent per year, in 2011 and 2012. Much of that fruit is filling the growing European demand, but their market may be a bit more mature than ours and growing less quickly.
The challenge for Washington growers is to avoid another overshoot with too many new acres at once. Demand in the United States shows no sign of slowing, and keeping supply in line with that demand will help stabilize prices.
With our amenable growing conditions, quality growers, and developed markets, the future looks good for organic fruit. •
ONLINE
More details on the organic fruit sector can be found on the WSU organic statistics website at bit.ly/1Hkb0wm.


Leave A Comment