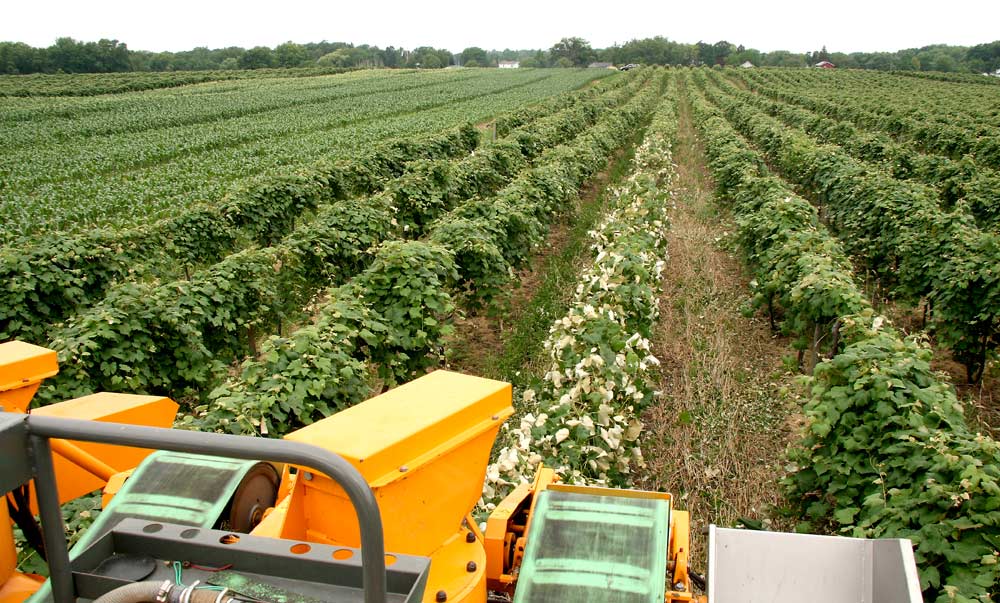
The scene overlooking a Concord vineyard owned by Thom and Bob Betts in Westfield, New York, in July. Harvesting unripe grapes from several small sections of their Concord vineyards months before harvest allows them to make more accurate crop load estimates and guide fruit thinning and other management decisions. They say that coupling the crop load data with spatial data helps to increase each block’s efficiency. (Kate Prengaman/Good Fruit Grower)
On a humid July morning, growers Bob and Thom Betts were out in their Concord vineyards, harvesting hard green grapes.
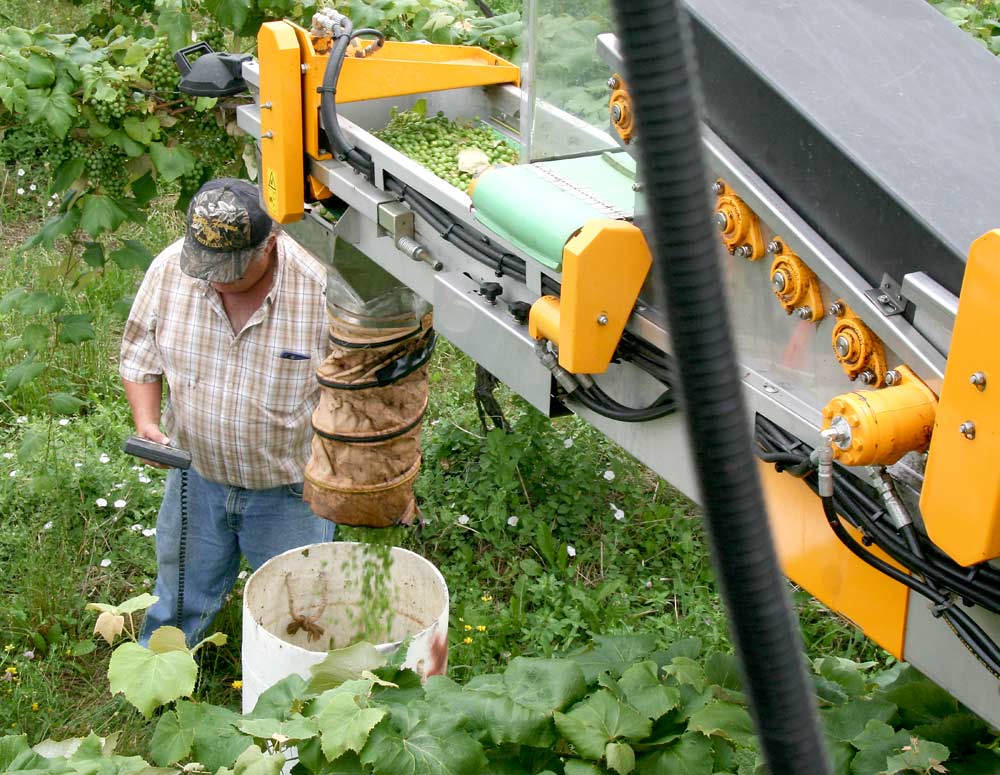
Guided by a multi-colored map of productivity zones in the block, they gathered and weighed small samples of unripe grapes to get a more accurate view of their crop load — ranging from 3 tons an acre to 11 tons an acre — well in advance of harvest.
“What we’re doing first is just crop estimating. When we get done with that block, if it needs thinned, we’ll go back and thin the higher yield areas,” said Thom Betts, as he guided the harvester, equipped with yield monitors, toward a sampling zone.
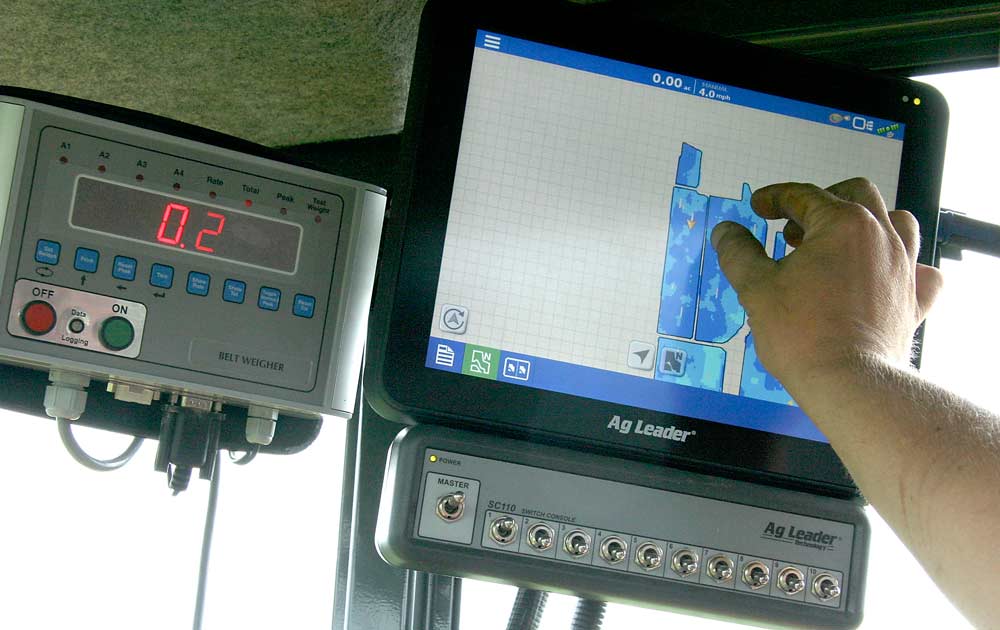
The zone, 100th of an acre, or 48 feet along a row, was highlighted on the map on his interactive display. “The color zones represent the vigor, and we want the harvester to take different amounts of fruit off in different vigor zones.”
This big-data informed farming appeals to Betts, a fifth-generation grape grower who farms 180 acres of Concords with his dad, Bob, in Westfield, New York, near the middle of the grape belt that stretches along the shore of Lake Erie from Buffalo to Erie, Pennsylvania.
Collecting spatial data on yield, canopy vigor and soils allows them to fine-tune management practices and maximize profit, he said.

Bob Betts weighs unripe Concord grapes to estimate crop load. Combining that data with maps of the vineyard’s health and productivity helps them figure out how to manage each block more efficiently, according to Cornell University researcher Terry Bates. (Kate Prengaman/Good Fruit Grower)
While others in the grape industry are waiting for camera-based crop load analysis programs currently in development, the Bettses are taking advantage of existing tools to get the same sort of data, said Terry Bates, director of the Cornell University Lake Erie Research and Extension Laboratory.
The Bettses are “the front-runners on this precision viticulture work,” he said, but he believes more growers will soon be turning to spatial data to adapt management practices and increase precision.
Bates is leading a national project aimed at providing juice, wine and table grape growers the tools they need to adapt management to vineyard variability, known as the Efficient Vineyard Project.
He and his colleagues want to help growers figure out the best way to use spatial ag data tools, such as canopy vigor in the form of NVDI analysis, yield monitoring and soil maps.
Many companies now offer such tools, but unless the tools connect maps to management, growers may end up with just pretty maps. Bates and his collaborators at Cornell; University of California, Davis; Carnegie Mellon University and Newcastle University in the United Kingdom aim to help growers transform spatial data into more efficient farming.
“The whole idea is to get to accurate variable rate management, whether it is fertilizer or fruit thinning or shoot thinning, and just to be able to have the map talk to the machines and tell it to speed up or slow down on the fly,” he said.
Crop load is key
The Bettses are in the vineyard 30 days after bloom. By that date, the berries have grown to about half the weight they will be at harvest, so collecting the fruit and doubling its weight gives the crop estimate. Bob Betts said he’s been doing it this way for more than 20 years.
But now, using canopy vigor maps developed with normalized difference vegetative index (NDVI) sensors, the crop estimate can more accurately reflect the variable performance of the block.
“Before the NVDI and this computer, it was all by the seat of my pants. But we trimmed clusters and I put all the fungicides on, so I had it in my head,” Bob Betts said, adding that the mapping tools allow him to make decisions for vineyards he now spends less time in.
The maps can show him which areas are chronically underperforming and where the crop load is high enough to stress the vines and put the fruit at risk of not ripening, which requires a gentle pass with the harvester to shake off a portion of the fruit.

Thom Betts adjusts the display on the map of productivity zones in his harvester as he collects samples of unripe grapes to make accurate crop load estimates in his family’s Westfield, New York, Concord vineyards. (Kate Prengaman/Good Fruit Grower)
Getting the crop load balance right helps this year’s crop ripen well and set the right number of buds for next year, Bates said.
That’s less of an issue for Western growers, who usually have ample light and heat to ripen as much fruit as the vines can set, said Craig Bardwell, senior viticulturist for National Grape Cooperative, who is based in Grandview, Washington.
“It’s a pretty rare year for our growers out here to produce a crop they can’t ripen to our minimum standards,” Bardwell said.
Occasionally, he’ll work with a grower who needs to thin a vineyard using the same harvester-driven crop estimation and thinning technique the Bettses use, but it’s not common practice in the West, he said.
In New York, thinning overcropped areas is key to maintaining productivity.
“For vine health, we should ride through that piece and knock those elevens down to seven or eight,” Betts said. Before the technology, Betts would have to estimate where to turn the harvester on and off to do that thinning, but now the maps track it for him.
The maps start with NDVI sensors that the Bettses and other Lake Erie-area growers borrow from the Cornell Extension lab to run through their vineyards while they do fungicide sprays.
Some Western wine grape growers collect the same data via drones, but in the wetter northeast, everything is so green that the row centers can mess up aerial maps of canopy, Bates said.
Then, the extension team’s spatial analyst processes that data into a map of meaningful zones of vineyard vigor.
Thom Betts repeats that process four times a year. “It’s great to map that because you are capturing the growth throughout the year,” he said. But, NDVI alone isn’t as useful as when it’s combined with soil and yield maps. “You need all of them to have a complete understanding of what is taking place in your vineyard.”
Implementing this system — and spending a few days in the harvester months before harvest — obviously adds labor and equipment costs. Bardwell says the practice is too labor-intensive for National Grape in Washington, and there is less incentive since thinning is rare.
He said he doesn’t know any Washington juice grape growers who have invested in the sensor technology yet, although one grower has recently bought a yield monitor for his harvester.
National Grape does do yield estimations across its 11,000 acres in Washington, based on cluster counts, berry counts and vine fruit weight samples at 60 days post bloom, but not in every vineyard. They get a good average, but it’s not accurate for individual growers.
Like many others in the industry, Bardwell said he is eager to see if automated fruit-counting camera systems can provide the level of detail they need in crop estimates.
“The thing that interests me personally is the development of the sensor that could do a crop forecast. It could help us refine our estimate by sampling more individual vineyards and get more data more quickly,” he said.
But, the sprawling, vigorous canopy of Concords is a challenge for the crop-estimate system in development by engineers at Carnegie Mellon University, who are also collaborating on the Efficient Vineyard Project, Bates said.
So far, that system seems to work better in the controlled canopies of wine grapes on VSP systems with leaf pulling that leaves clusters more exposed, he said. •
– by Kate Prengaman


Leave A Comment