




Last year, Washington packers shipped 58 different apple varieties to their customers, according to shipment reports sent to the Washington State Tree Fruit Association, which maintains industry data as a service to its members.
That sounds like a lot of cultivars, but the total is down from the peak of 70 cultivars in 2020, when sales desks were still clamoring to introduce new apples and Cosmic Crisp had yet to disrupt the category.
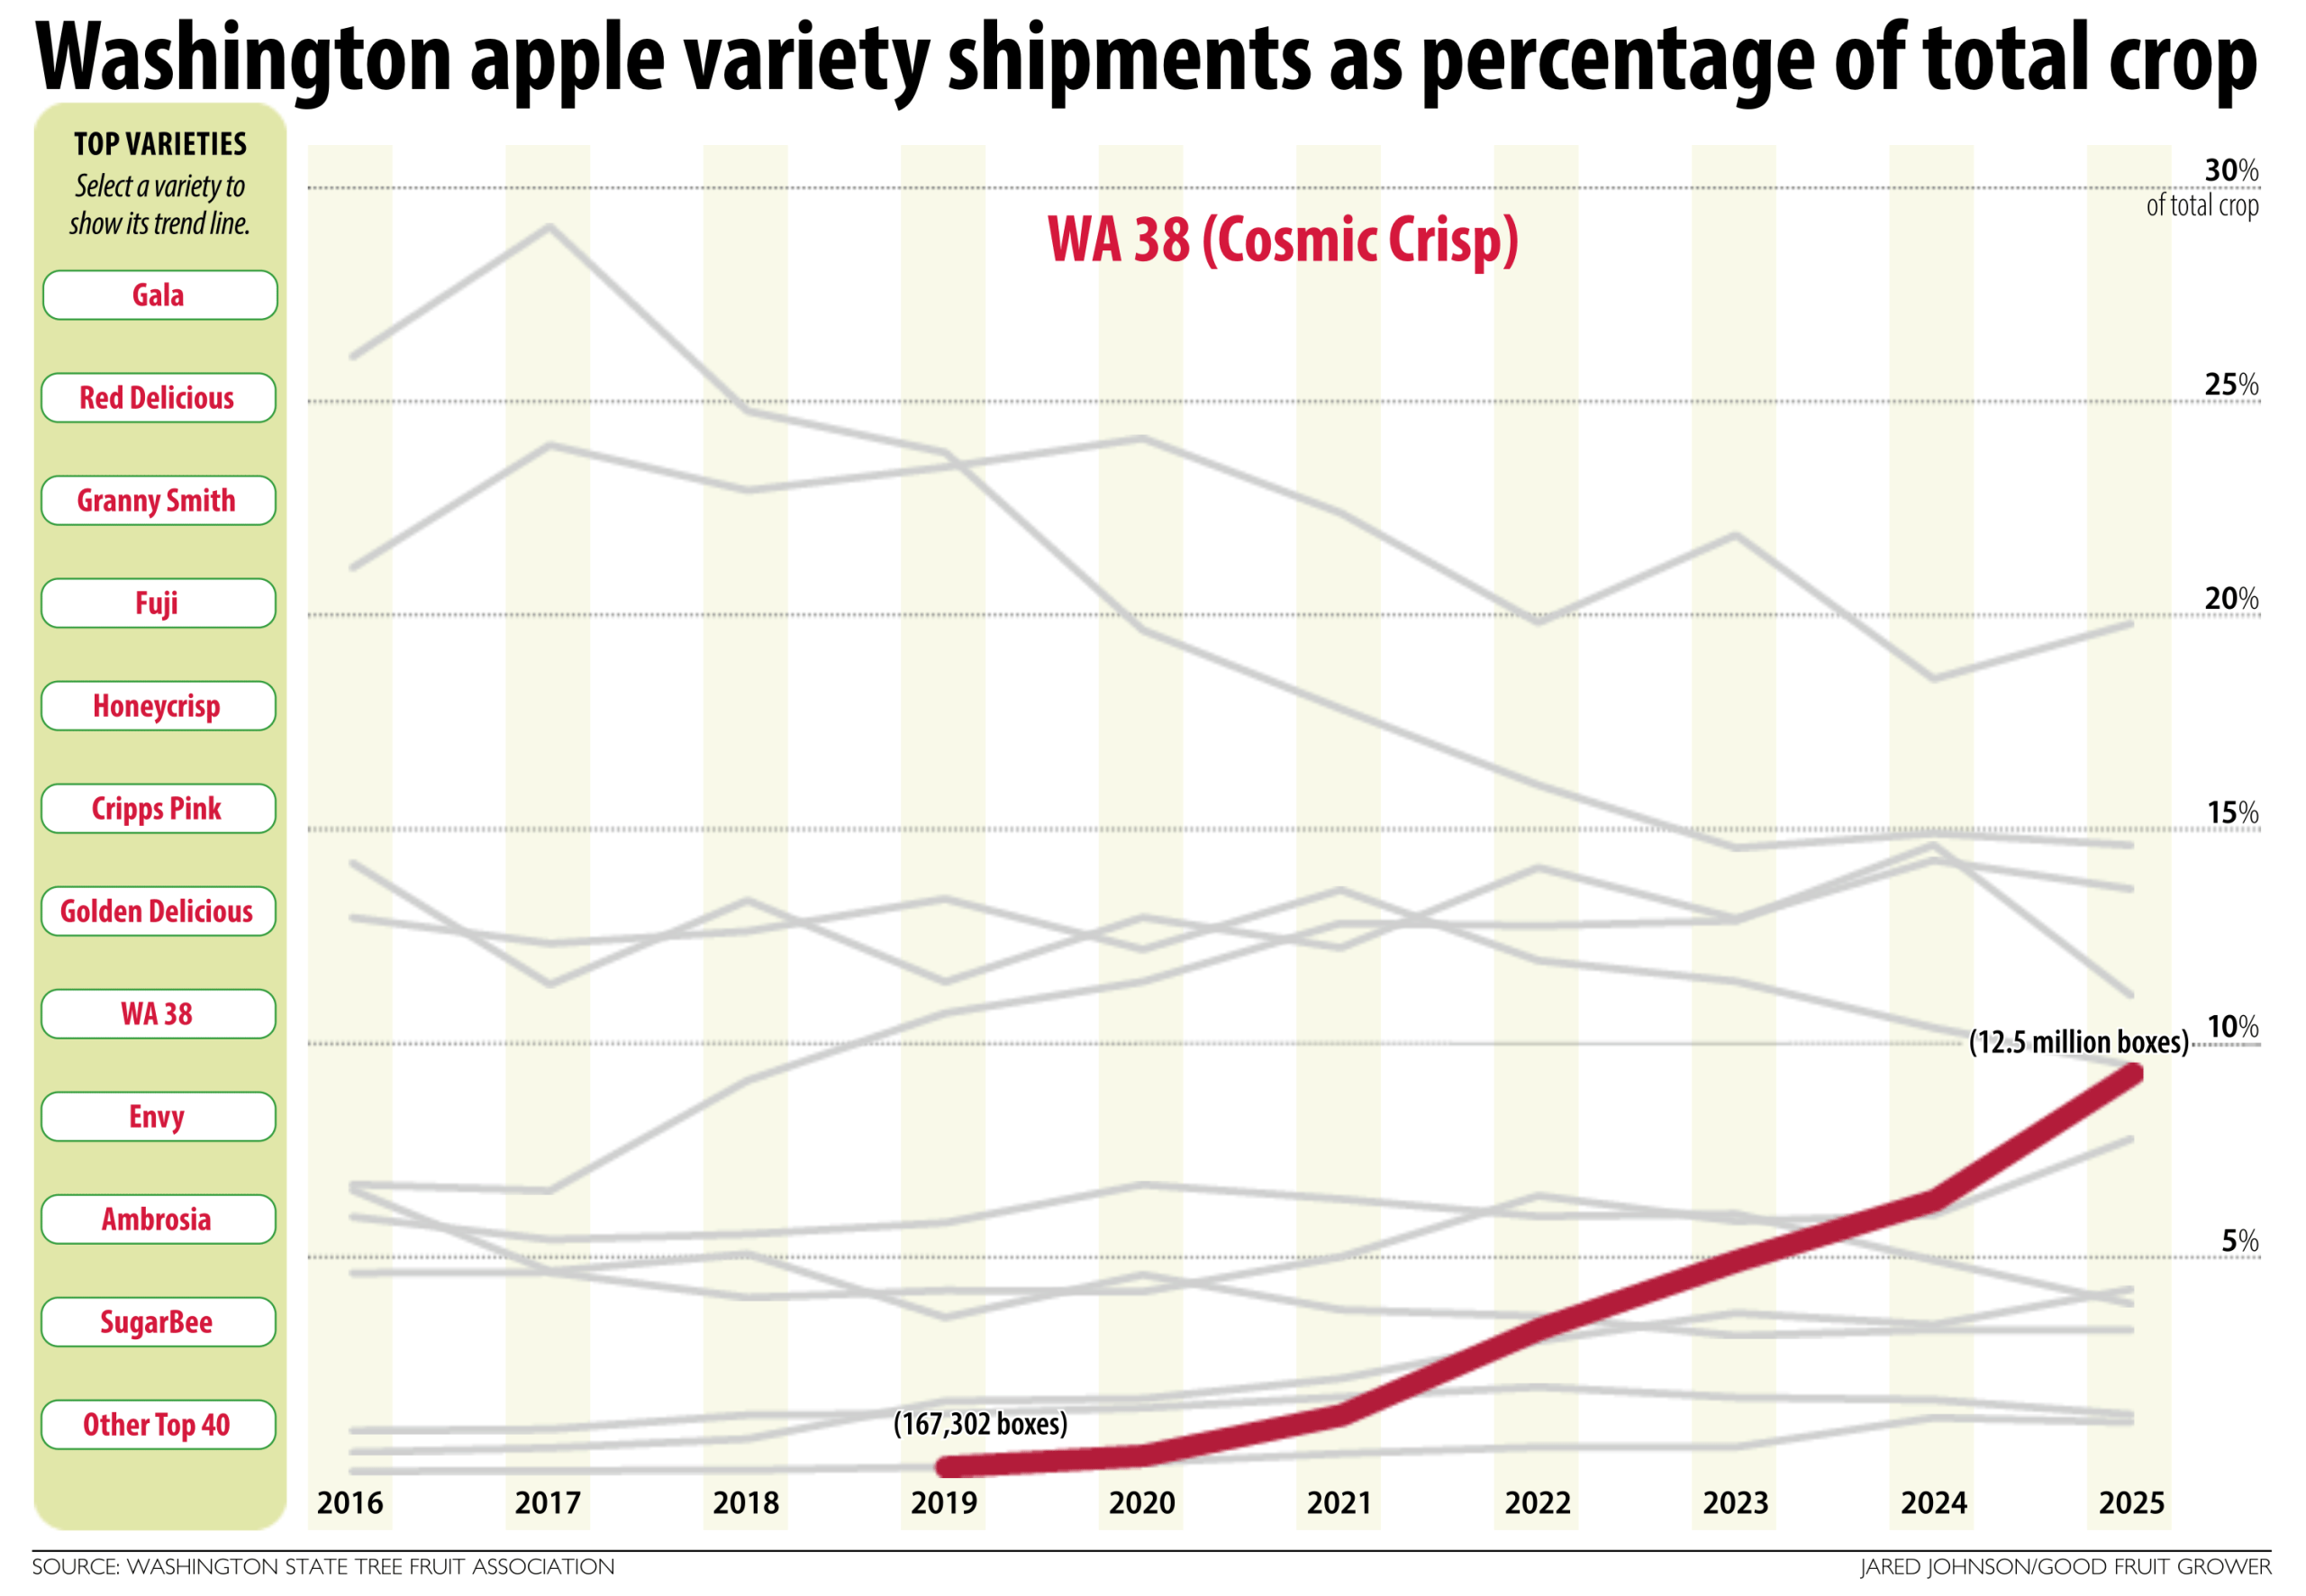
Yes, WA 38’s cosmic growth in seven years, to represent 10 percent of the Washington apple crop today, did change the landscape for other apples, but so, too, have the higher costs of production and generally lower apple returns of the past several years.
The combined effect creates an economic squeeze on all new varieties introduced in the heyday of the preceeding decade.
So, we wanted to know, how have the recent market forces reshaped Washington’s varietal mix? To answer that question, we partnered with Steve Bunnell, the association’s director of data and analytics, to analyze apple shipment reports over the past decade — including a dive deep beyond the top 10 varieties.
Bunnell suggested that we look at the data based on annual shipments, rather than crop year, if we were more interested in the trends in apple consumption than in the variation in Mother Nature’s production.
He also suggested we present the data for each variety in terms of the percentage of the total crop, rather than in total volume, since the volume varies from year to year.
“By using percent of total shipments, we see how the market is reacting to consumer preferences without it being influenced by external factors, by all the factors that influence how big the crop is,” he said.
WSTFA reports typically focus on the top 10 varieties by volume each year, because those are the varieties that make up well over 90 percent of Washinton’s apple crop. We decided to focus our analysis on the top 40, to capture the second tier of cultivars that also make meaningful contributions to growers’ bottom lines and where there has been a significant amount of shake-up in recent years.
Instead of a top 10, you’ll see our chart shows the top 11 varieties.
In 2025, there were 11 varieties shipping over 1 million boxes: Gala, Red Delicious, Granny Smith, Fuji, Cosmic Crisp, Honeycrisp, Cripps Pink, Envy, Golden Delicious, Ambrosia and SugarBee. The next 29 cultivars together round out the top 40. They totaled 5.2 million boxes in 2025, roughly comparable to last year’s Envy shipments, or about 4 percent of total apple volume.
Comparatively, in 2020, that “rest of the top 40” figure accounted for 8.9 million boxes and 6.7 percent of the overall crop. Taken together, you can see how many of those “other” varieties have been strained by the competitive pressure of Cosmic Crisp’s growth and other market challenges, even though some cultivars clearly continue to thrive.
Rounding out the 58 to 70 cultivars, depending on the year, are heritage holdouts, such as Winesaps and Newtons, that clock a few hundred or thousand boxes a year, along with newer cultivars either fading out or just beginning their introduction. We opted to let those go uncharted.
Beyond the rise in Cosmic Crisp and the ebb and flow in the sum total of the top 40, the most prominent trend in the chart remains the decline in Red Delicious — although going from 25 percent to 15 percent is a far cry from the drop it has taken since the 1980s when Red Delicious claimed 75 percent of the total. •